

How to create a Simple Column Chart in Excel 2010
Description: This article describes how to create a simple column chart in Excel 2010.
- To create a simple column chart in Excel 2010, there first must be some data available to chart. In the example below, there is weekly data for Pizza sales.
- Click on the far corner of the dataset. While keeping the mouse button held down, drag to other corner of the dataset and release the mouse button. The data should now be selected.
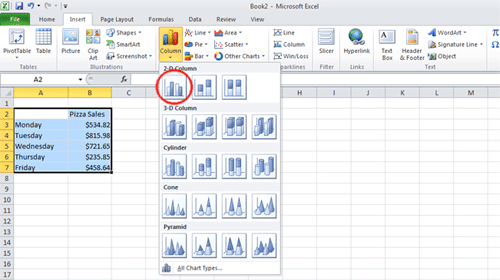
- Click on the Insert tab.
- In the Chart category on the ribbon, click on the arrow below the word Column.
- This will provide a box with common column chart types. For purposes of this example, the first option has been selected.
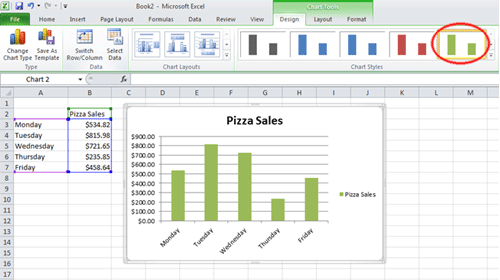
- When the column type is clicked on, a new column chart based on the data selected will be created.
- The color scheme of the column chart can be changed by clicking different selections from the Chart Styles category.
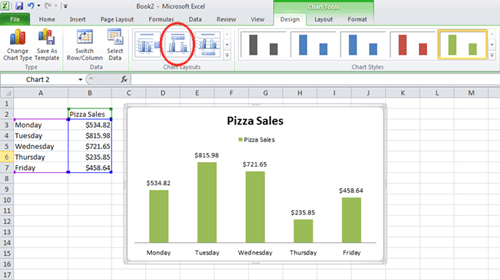
- Labels and other features can be easily applied by clicking different buttons in the Chart Layouts category.
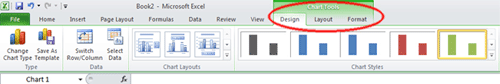
- In addition to this, when a chart is selected, three new tabs will appear in the ribbon under the title Chart Tools. These tabs should be explored as there are many options available here for advanced chart formatting.

Technical Support Community
Free technical support is available for your desktops, laptops, printers, software usage and more, via our new community forum, where our tech support staff, or the Micro Center Community will be happy to answer your questions online.
Forums
Ask questions and get answers from our technical support team or our community.
PC Builds
Help in Choosing Parts
Troubleshooting