
Intel Raptor Lake Review: Intel’s 13th Generation Chips Explained
Here’s everything you need to know about Intel’s 13th generation Raptor Lake processors so you can find the right CPU for you.Reviews

Intel’s 13th generation Raptor Lake CPUs made a big splash at their debut, offering stiff new competition to even the latest and greatest processors from the competition, and heaps of potential for gamers and workers alike. Whether you’re looking for a CPU to spit out more frames in your favorite games, or are hoping to cut down on rendering and processing time for your day job, the latest Intel Raptor Lake processors are true monsters ready and capable for the task.
But don’t dive in without seeing the lay of land of the processing landscape. Here’s everything you need to know about Intel’s 13th generation Raptor Lake processors so you can find the right CPU for you.
Raptor Lake – An Overview
Intel’s 13th generation Raptor Lake processors are an evolution of the 12th generation Alder Lake designs, with the same mix of performance (P) and efficiency (E) cores, but with the latter in greater numbers, and more prolific throughout the range of processors. All cores of every type have higher clock speeds, too. There are some increases in instructions per clock for the new Raptor Lake core design, and Intel has enhanced the Gracemont architecture behind its E cores.
Raptor Lake also increases cache totals over Alder Lake, with a 60% increase in the L2 cache overall (with double the cache on the E cores) and an increase in L3 cache, too. The result of this should be a nice boost to gaming performance and in memory-dependent applications.
The whole thing is built on an enhanced version of Intel’s 10nm, Intel 7 process node, which should help improve performance and efficiency a little, but the big reason behind this generation’s enhancements is in the added maturity of the node. This has allowed Intel to increase yields and cherry pick silicon to eke out a bit more power. That’s what’s made the greater core counts and clock speed increases possible, which are the true might of this generation of CPUs
Like Alder Lake before it, Raptor Lake is based on the LGA 1700 socket. That means that all existing Alder Lake motherboards can work just fine with Raptor Lake processors after a BIOS update. The new Z790 motherboards bring with them additional support for features like Thunderbolt 4 and Wi-Fi 6E. They also expand support for faster DDR5 memory, and PCIExpress 5, though on select motherboards there is still support for DDR4 memory for those looking for a more budget-friendly overall system build.
Raptor Lake Specifications
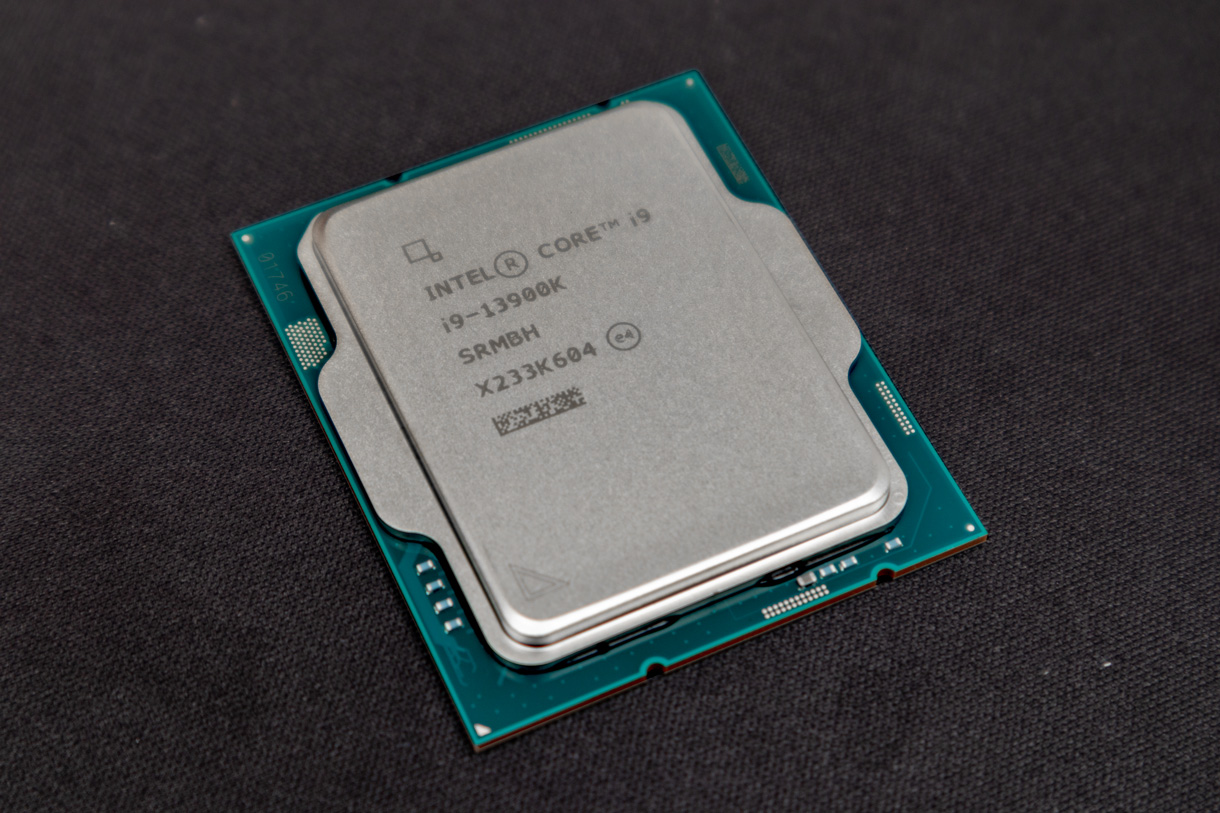
Before we test how these processors perform in the real world, let’s take a look at the CPUs that Intel has released for its Raptor Lake generation so far: The Core i9-13900K, the Core i7-13700K, and the Core i5-13600K, alongside a few other 13th Gen CPUs.
For more information on what these different designations mean, refer to our detailed PC build guide.
| Core™ i9-13900K | Core™ i9-13900KS | Core™ i7-13900K | Core™ i7-13700 | Core™ i5-13600K | Core™ i5-13400 | |
|---|---|---|---|---|---|---|
| Architecture | Raptor Lake / Gracemont | Raptor Lake / Gracemont | Raptor Lake / Gracemont | Raptor Lake / Gracemont | Raptor Lake / Gracemont | Raptor Lake / Gracemont |
| Process | Intel 7 (10nm) | Intel 7 (10nm) | Intel 7 (10nm) | Intel 7 (10nm) | Intel 7 (10nm) | Intel 7 (10nm) |
| Cores | 24 (8P+16E) | 24 (8P+16E) | 16 (8P+8E) | 16 (8P+8E) | 14 (6P+8E) | 10 (6P+4E) |
| Threads | 32 | 32 | 24 | 24 | 20 | 16 |
| P Core base clock | 3GHz | 3.2GHz | 3.4GHz | 2.1GHz | 3.5GHz | 2.5GHz |
| P Core boost clock | 5.8GHz | 5.4GHz | 5.4GHz | 5.1GHz | 5.1GHz | 4.6GHz |
| E Core base clock | 2.2GHz | 3.2GHz | 2.5GHz | 1.5GHz | 2.6GHz | 1.8GHz |
| E Core boost clock | 4.3GHz | 4.3GHz | 4.2GHz | 4.1GHz | 3.9GHz | 3.3GHz |
| Cache (L2 + L3) | 68MB | 68MB | 54MB | 54MB | 44MB | 29.5MB |
| Graphics | Intel UHD 770 | Intel UHD 770 | Intel UHD 770 | Intel UHD 770 | Intel UHD 770 | Intel UHD 770 |
| TDP | 125W | 150W | 125W | 65W | 125W | 65W |
| Max Power | 253W | 253W | 253W | 219W | 181W | 154W |
Note: While Intel has released a number of versions of these CPUs, we’ll be focusing our discussion on the Core i9-13900k, Core i7-13700k and Core i5-13600k versions, which we have to hand for testing.
While the specs table doesn’t tell the whole story of how capable processors can be, it can give an insight into what the chips might be capable of, and how they compare to one another throughout the product stack.
The most obvious change from the previous generation here is the increase in core counts. While performance core totals remain the same compared to their last-generation counterparts, there are far more E cores available this time around. The 13900K and 13700K double their E core count from their predecessors, with 16 and 8 E cores a piece. This should lead to a big uplift in multi-threaded performance in applications where those cores can be leveraged, though may not affect gaming and more limited thread applications, like Photoshop, as much.
The 13600K takes a big leap too, doubling the E cores from the 12600K to eight. That should democratise multi-threading performance for this generation far more so than the last, so it will be interesting to see how this chip compares to the more expensive models in real testing
TClock speeds have increased dramatically this generation, too, by over 500MHz in some cases. The 13900K can now hit up to 5.8GHz when it has the thermal and power headroom to do so, with the 13700K and 13600K both reaching beyond 5GHz – a feat that was exclusively reserved for Core i9 CPUs in generations past.
All of these core count and clock speed enhancements come at a cost, though: power. Where previous generation CPUs have had double digit TDP options lower down the stack, there’s nothing like that here. Even the humble 13600K has a nominal TDP of 125W, and a maximum power draw of 181W. That’s nothing compared to the 13700K and 13900K, though, which will push beyond 250W if given the chance.
That’s going to demand a lot of cooling to make the most of these CPUs – especially if you want to do any kind of overclocking. All of the CPUS we’re looking at here support it, however, thanks to their K-series designation. That means we may be able to push clock speeds of the P cores and E cores, as long as our cooling can keep up.
Test Bench and Methodology
- CPUs: Intel Core i5 13600K, Core i7 13700K, Core i9-13900K
- CPU Cooler: MSI MAG Coreliquid 360R V2 360mm AIO w/ LGA 1700 kit
- Motherboard: ASUS Prime Z790-P WiFi
- RAM: 32GB DDR5 Corsair Vengeance 5200MHz C42
- Graphics: PowerColor Red Devil 6950XT
- PSU: EVGA 850 GT Gold
- Case: Cooler Master MasterFrame 700
- Operating System: Windows 11 22H2
I completed all tests multiple times and took the average of scores to ensure fairness and avoid anomalies, where possible. The drivers and motherboard BIOS were updated to the latest available.
The memory was run using its overclocked XMP profile at 5200MHz, with CL42 timings. Ambient temperature was recorded at 22 C throughout. Fans were set to run in performance mode with aggressive fan curves to ensure that the CPUs shouldn’t experience any thermal throttling. The test bench is open air, so when we discuss temperatures, know that they would likely be higher in a standard desktop PC case
Synthetic and Productivity Benchmarks
Synthetic benchmarks are a useful tool for testing a processor’s raw performance. They make it easy to compare them amongst each other, and to see clear and trackable improvements through overclocking and undervolting. They aren’t always a perfect example of real-world performance, but I’ve tried to mitigate that with the choice of benchmarks I’m running these processors through.
The list of benchmarks is as follows:
- 7Zip – Using the default, built in benchmark.
- Cinebench R23 – Single and multi-threaded benchmark runs for 10 minutes each.
- PugetBench for Photoshop – Standard settings, noting the overall score
These benchmarks will give us a mixture of raw performance numbers and an estimation of real-world performance in productivity tasks like Photo editing. This will give us a clear understanding of what improvements Intel has made to the processor design, as well as the effect of adding so many new efficiency cores, and increasing clock speeds so dramatically.
7Zip
7Zip is an iconic, free and open source file archiver that is designed to compress and decompress files or groups of files into a single archive to reduce their overall file size. The process is very CPU intensive, with higher-end, multicore processors able to complete archival tasks far faster than slower, lower-end CPUs. That makes it a super useful tool for testing processor performance.
While it is possible to perform real world tests by timing the completion of a compression and/or decompression on a file or collection of files, 7Zip also has a handy built in benchmark, which we used for our testing. It runs a standard compression and decompression using the LZMA method (a lossless data compression algorithm), and outputs a rating in million instructions per second (MIPS).
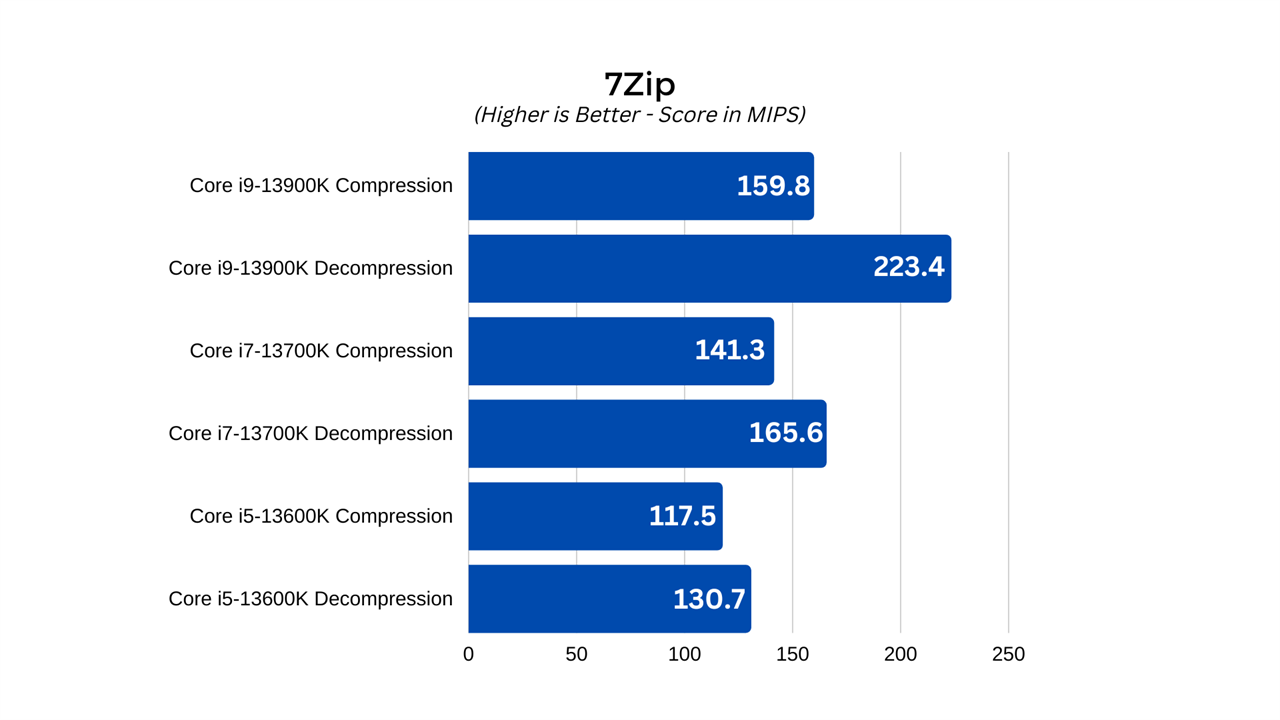
The results from our testing show very quickly how well 7Zip scales with more cores, and how the 13th generation Intel CPUs can offer big performance improvements as you move up the line. The Core i5-13600K came out the gate with respectable scores of 117.5 and 130.7 MIPS, for compression and decompression, respectively. That puts it ahead of the comparably priced competition and makes major leaps over the previous generation, but it’s nothing on what the higher-end chips managed.
The 13700K leverages its higher clock speeds and additional two performance scores to great effect, managing compression and decompression scores of 141.3 and 165.6 MIPS respectively, but the 13900K is the CPU that really shines in 7Zip. With its eight performance cores, and massive 16 efficiency cores, it was able to score 159.8 and 223.4 MIPS, respectively.
There really is no comparison, here. If your job or home life involves a lot of archiving, the Intel Core i9-13900K is by far and away the best CPU for the job and will save you precious seconds on every run.
Cinebench
Cinebench R23 is the latest release of the Cinema 4D benchmarking application from Maxon. It forces the CPU to generate a 3D render of a scene in real time. You can select multi-thread or single-thread runs, which either provides no limitations to the CPU or forces it to use just a single thread for the render. This generates a score and offers direct comparisons with stock runs of mainstream processors from recent generations, including prosumer and server CPUs.
Although not exactly reflective of real-world workloads, Cinebench provides a very clear example of single and multi-threaded performance enhancements between generations, and among processors from the same generations. That’s especially true when it comes to comparing CPUs with different clock speeds and core counts, as the different tests should highlight where the performance enhancements are mostly coming from.
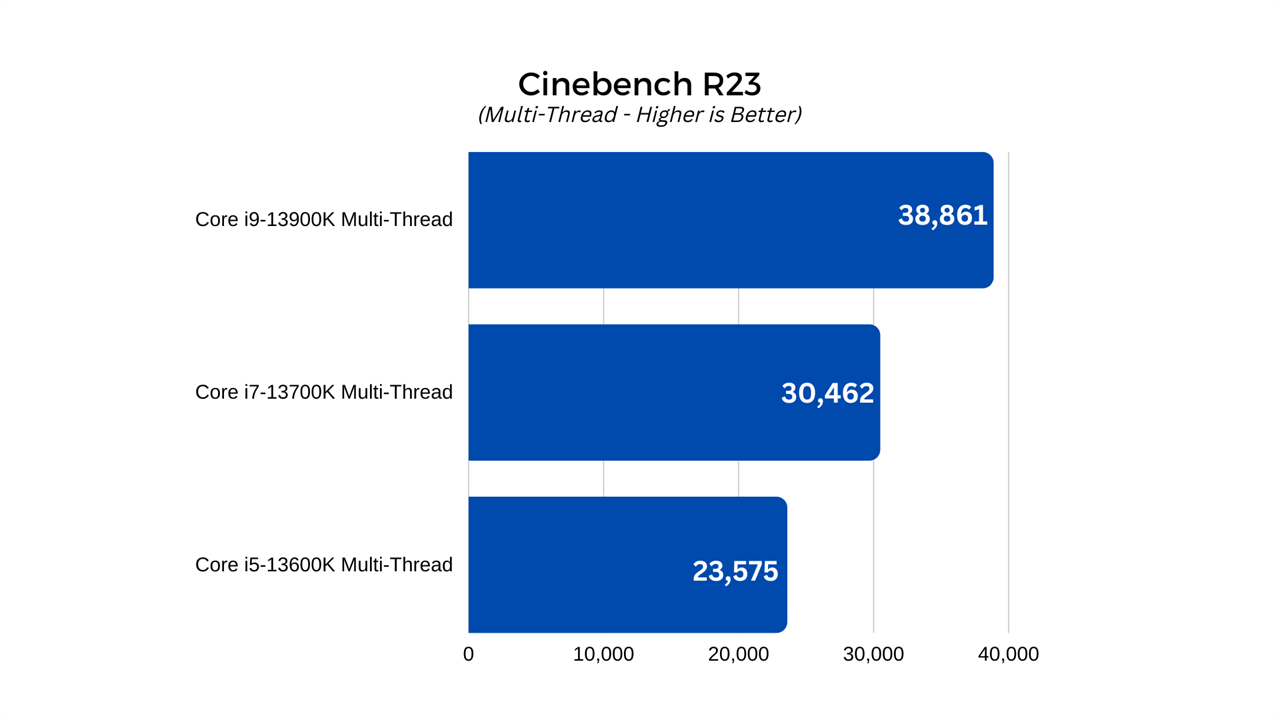
Like 7Zip, Cinebench R23 showed clear advantages for the higher-end CPUs, especially in multi-threading where the greater core counts and higher clock speeds combine for impressive results. However, the Core i5-13600K is no slouch. It managed single and multi-threaded scores of 2,011 and 23,575 points, respectively. These scores put this processor way ahead of its predecessors from any Intel generation, and make it very competitive with some of the top CPUs from the 12th generation.
Just as impressive is the Core i7-13700K which, with just two more cores and four more threads, managed a multi-threaded score of 30,462. That’s faster than most high-end desktop CPUs from recent generations with much higher core counts, and shows that the higher clock speeds and additional performance cores still make a big difference to CPU performance, even when E core numbers are close.
As with 7Zip, however, the Core i9-13900K absolutely runs away with this one. Its single threaded results reached 2,227, showing just how fast this CPU can be on a single core when it has the headroom to hit high clock speeds. That said, it is just 10 percent faster on a per-core basis than the much more affordable 13600K, so bear that in mind if you don’t expect to use a lot of threads in whatever you have planned for your next upgrade.
If you do plan to use a lot of threads, though, the 13900K is an absolute monster. It hit almost 40,000 points in our testing (38,861). That’s an incredible score that rivals even big server CPUs and shows just how fast the mainstream sector is enhancing performance for these top CPUs.
The one caveat here, however, is that the 13900K should have performed even better. As we’ll discuss in the Power and Thermals section below, the 13900K ran into a thermal wall during testing. Even with our 360mm AIO running at full speed, it couldn’t prevent some thermal throttling during the extended Cinebench run. This is a CPU that needs serious cooling if you want to make the most of it.
PugetBench for Photoshop
PugetBench for Photoshop is an extension for Adobe Photoshop that performs a number of automated tasks within the application to see how the system running it can handle it. Developed by Workstation system builder Puget Systems, the benchmark loads up various stock imagery and forces the system to rotate them, add colors, and make further adjustments to the picture. At the end, it spits out a range of scores for how well the system performed.
For our testing, we noted the Overall Score of each CPU after it had completed the run.
Since Adobe Photoshop is well known for preferring faster cores to greater numbers, this was designed to be an interesting test of each processors per-core performance, whilst also taking note of where the added E cores could make a difference. It works as a good companion for our other synthetic benchmarks.
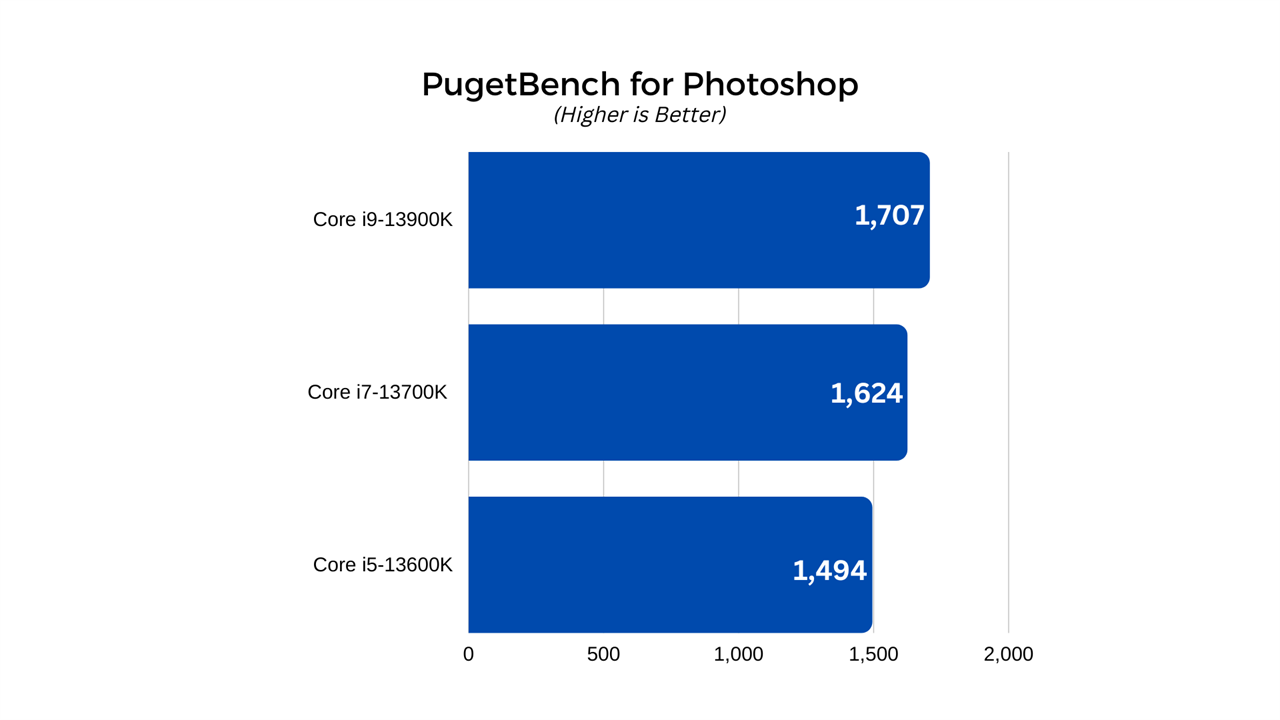
Here we see modest uplifts in performance for the higher-end CPUs. The Core i5-13600K managed a score of 1,494, while the 13700K and 13900K managed scores of 1,624, and 1,707 respectively.
This is about what I expected to see, with the higher clock speeds of the top chips giving them a slight advantage, but nothing like all those additional threads should allow in more multithreaded applications.
The graphics cards used are third-party releases from board partners, so aren’t completely indicative of NVIDIA’s reference Founders Editions versions. Cooling, power usage, and clock speeds will be slightly different, but should still give a good general idea of how well these new generation cards perform. These tests were also performed on an open-air test bench, so temperatures and clock speeds may be slightly higher than you would see if these cards were placed inside a typical gaming PC. Systems with strong overall cooling, however, should be able to replicate these results easily enough.
Gaming Benchmarks
As great as synthetic and productivity benchmarks are for telling us how fast these Intel 13th generation CPUs are, many adopters of high-end hardware are gamers, and the performance that matters to them is gaming performance. With that in mind, I put each of these CPUs through their paces in a number of games, testing them at 1080p and 4K resolution, to see how they each handles different types of games, and how they compare to one another.
The games I used for testing were as follows:
- Metro Exodus Enhanced Edition
- Shadow of the Tomb Raider
- Red Dead Redemption 2
- Civilization VI
These games represent a spread of recent and slightly-older games, with some demanding more from the graphics card, and others from the CPU. Civilization VI also gives us a great chance to see how well the CPUs handle AI calculations too, telling us just how quickly you can get back to ordering your workers around.
Metro Exodus Enhanced Edition
Metro Exodus Enhanced Edition is the updated and heavily upgraded version of Metro Exodus, one of the first games to enable ray tracing, and a very pretty game in its own right even if you don’t enable that advanced lighting feature. It’s a game that’s heavy on the GPU, so I don’t expect to see a lot of variance between CPU models, but the higher-end options should still deliver the best results.
I used the official benchmark application for this test, with the following settings:
- 1080p resolution, Ultra preset
- 4K resolution, Ultra preset
In both cases ray tracing was turned off to ensure that the GPU wasn’t put under too much load, hopefully illuminating any CPU bottlenecks, and showing the potential for upgrading the processor to a more capable Raptor Lake model.
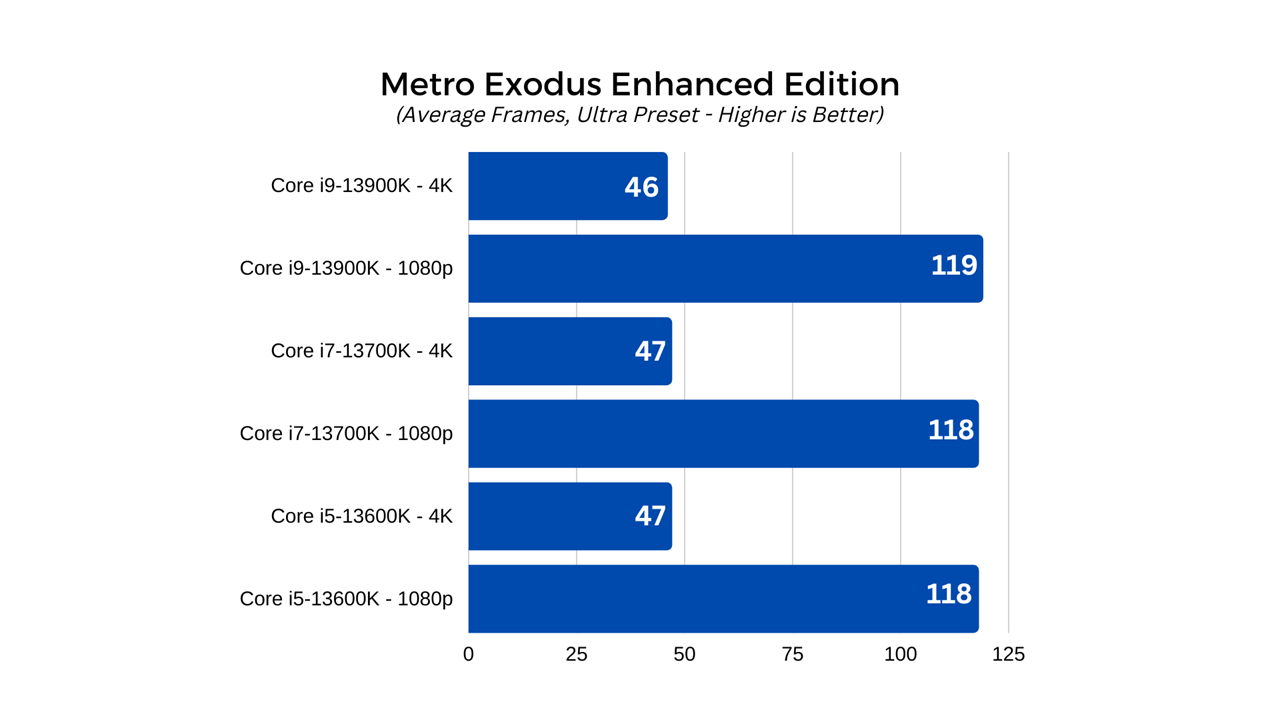
Unfortunately, even without maxing out the settings and keeping ray tracing off wasn’t enough to see this game restricted by CPU performance. Indeed, whether it was at 1080p or 4K, all three processors performed about the same.
The Core i5-13600K had minimum, average, and maximum frame rates of 73, 118, and 174 FPS at 1080p, and 36, 47, and 64 at 4K. Those are good frame rates that show these new Raptor Lake processors can take full advantage of whatever GPU power you bring to bear. But there doesn’t appear to be much benefit in buying a more powerful Raptor Lake CPU if this is the sole game you’re going to play.
The core i7-13700K spat out frame rates of 74/118/and 175 FPS at 1080p, and 36/47/and 62 FPS at 4K. These kinds of small, single frame rate differences are within the margin of error for a test like this, suggesting that Metro Exodus: Enhanced Edition is simply too GPU bound to notice much difference between CPUs.
The Core i9-13900K only confirmed these suspicions, managing 73, 119, and 176 FPS at 1080p, and 36, 46, and 61 FPS at 4K; almost identical to the results from the more budget-friendly 13th gen CPUs. However, we did see more drastic differences in some of the other titles we tested.
Shadow of the Tomb Raider
Shadow of the Tomb Raider is the most recent game in the latest Tomb Raider reboot, and, like Metro Exodus, was one of the first games to introduce ray traced shadows – Nvidia even used it as one of its debut titles for the RTX 2000 Turing series of graphics card. Although it’s a few years old, it’s still a great looking game and it scales really well with both higher-powered graphics cards, and faster CPUs. Its built-in benchmark also gives us heaps of detail to work with, so we’ll be using that for our test here today.
I tested the game at 1080p and 4K resolution with the following settings:
- 1080p resolution with all settings turned up to their maximum. Highest preset, but with ray tracing disabled
- 4K resolution with all settings the same as above
Screen Space Contact Shadows and Pure Hair were set to “normal,” and anti-aliasing set to TAA, in each benchmark run.
With this, I hope to both replicate the high-end settings someone may use at these resolutions and with a brand-new processor, but also make the game as CPU-bound as possible to best show off the differences between these Intel CPUs. The results taken were from the CPU Game frame rate results, with Minimum, Average, and 95% minimum FPS considered.
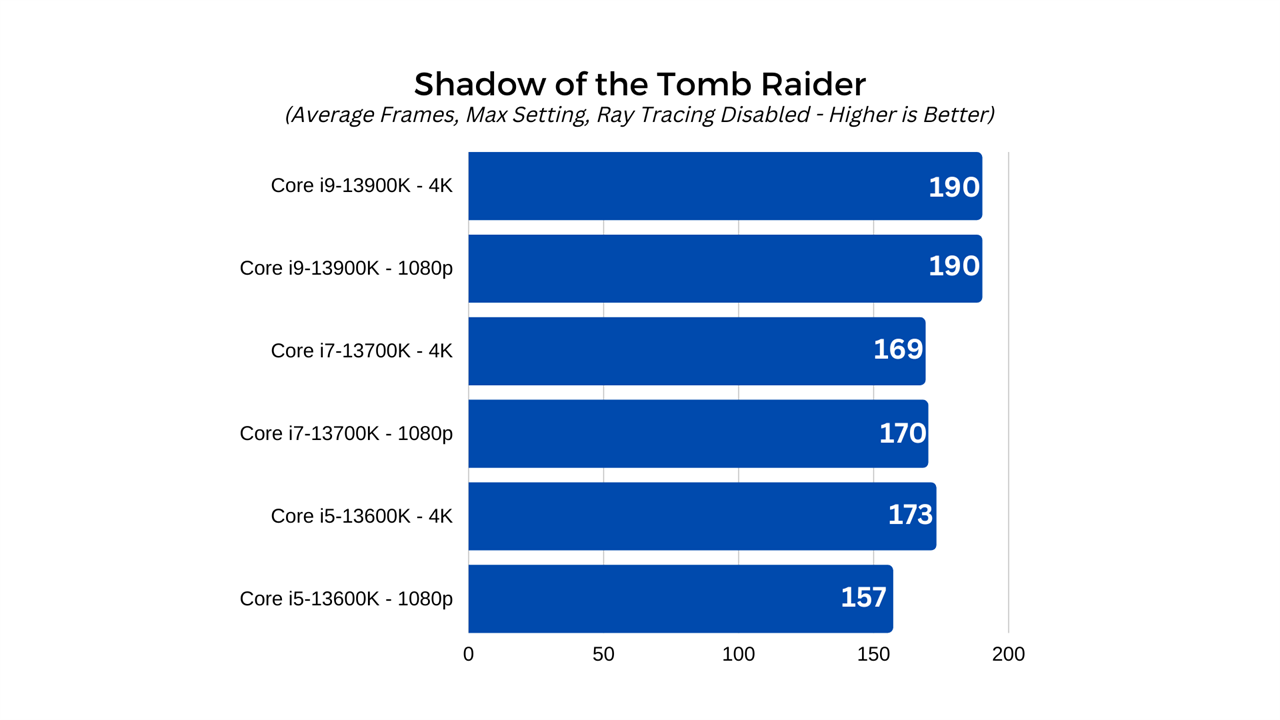
The Core i5 CPU put out fantastic frame rates in this game, managing minimum, 95%, and average frame rates of 151, 157, and 202 FPS, respectively. Although these kind of frame rates are more than enough for a game like this, the Core i7-13700K does give some notable improvement. In its minimum, 95%, and average results, we saw 167, 170, and 222 FPS, respectively. That’s a notable bump, especially in the 95% lows, which in a game with lower frame rates (or at higher detail settings) might lead to a smoother gaming experience.
The same could be said of the 13900K, too, which delivered frame rates of 189, 190, and 239 FPS, respectively, at 1080p. It’s great to see the top chip offering more FPS, but does that translate into 4K? Let’s take a look at the 4K results to see if that can condense the benefits into something more tangible.
At 4K, the Core i5-13600K manages minimum, 95% lows, and average frame rates of 172, 173, and 214, respectively. That might seem surprising, to actually have better performance at 4K, but that is likely to be because the GPU can stretch its legs some more and both it and the CPUs can therefore perform at closer to their peak.
The 13700K managed 176, 169, and 225 FPS, while the 13900K pushed results to 189, 190, and 239, respectively.
Once again, the 13900K is clearly the fastest CPU, but you’ll get almost the same fantastic results with the 13600K and 13700K, suggesting, so far at least, that mid-range CPUs are perfectly viable for even high-end gaming PCs, with the highest-end chips able to eke out that bit more performance at the top end.
Red Dead Redemption 2
Rockstar’s Red Dead Redemption 2 might be getting a little long in the tooth, but it’s still one of the best-looking games available today. With its built-in benchmark it’s easy to make uniform and repeatable runs of the game to test our CPU’s performance. I ran the game using that built in benchmark at two detail settings:
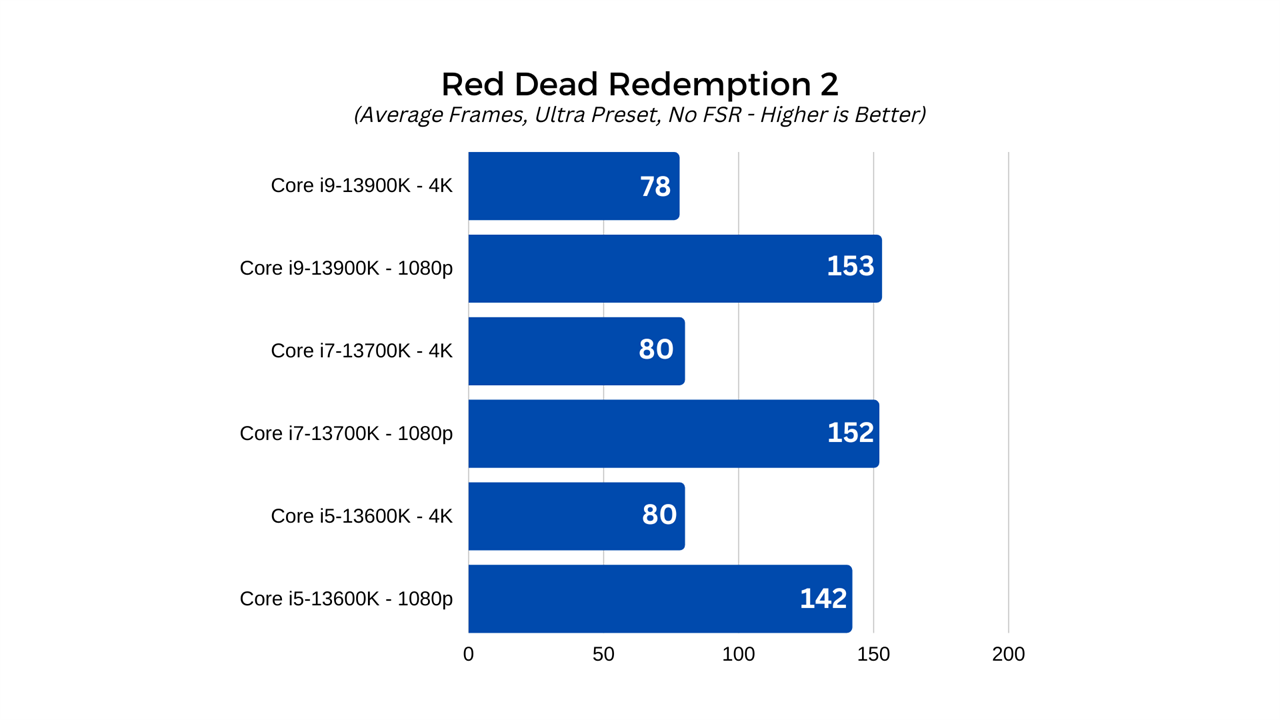
- 1080p resolution with the ultra preset, everything else manually set to Ultra or High, whatever is highest, with motion blur and FSR turned off. TAA set to high, MXAA and FXAA off, reflection MSAA and tree tessellation off.
- 4K resolution with the same settings as above.
The Core i5-13600K managed minimum, average, and maximum frame rates of 20, 142, and 152 FPS at 1080p. I observed little in the way of stuttering throughout the run, so suspect the absolute minimum frame rate was a minor spike low at some point during the run. These are respectable frame rates, and show that with a good GPU and CPU combined, you can get a very smooth experience with Red Dead Redemption 2.
The Core i7-13700K raises the bar a little more – especially at the top end of the scale. It managed frame rates of 20, 152, and 237. The Core i9-13900K achieved the best scores at 1080p, with frame rates of 20, 153, and 256 – though its notable that the average is almost identical.
At 4K the difference between the CPU is lessened even more. The 13600K managed frame rates of 20, 80, 208 FPS. The 13700K was a little faster at the top end, with 20, 80, and 237 FPS respectively, while the 13900K was actually slightly slower, managing 20, 78, and 222 FPS.
Here we can clearly see there is some benefit to using the Core i7 CPU, but the Core i9 doesn’t offer much in the way of performance enhancements, and may, in fact, hold you back in some niche settings. That’s unlikely to be something that plays out much in real world gameplay, but it was a phenomenon we saw repeated on multiple benchmark runs, so clearly, it’s at play here. Either way, all three chips offer an average of 60+ FPS and cap out over 200 FPS, so it’ll run fantastically smooth, no matter the chip.
Civilization VI
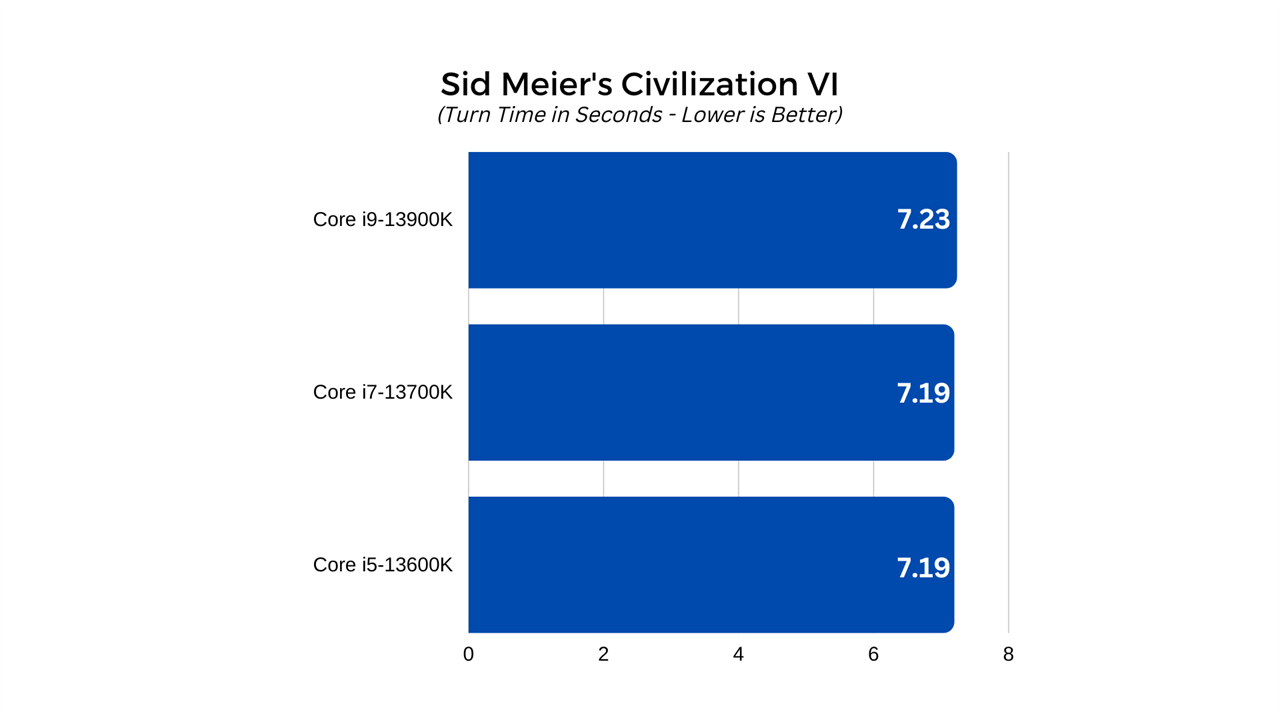
Civilization VI is a pretty game, for its type, but it’s not designed to be the most graphically demanding or immersive. That’s not what we’re looking at here, however. Although you can test your GPU and CPU up against the game’s 3D rendering capabilities, you can also run a handy little benchmark for testing the AI turn time. In between turns, when the computer opponents do their thing, it can take a lot of calculating, and slower, older PCs can really bog down during complex turns.
With that in mind, I ran each processor through the game’s built-in AI benchmark and noted down the time it took for it to complete. Although it shouldn't have much of an effect on performance, all in-game graphics settings were set to Ultra, and the resolution at 1080p.
Although we have seen differences with this benchmark with other CPUs of different companies and generations, here there appears to be no discernible difference. The Core i5 13600K and Core i7-13700K managed turn times of just 7.19 seconds, while the Core i9-13900K managed it in 7.23 seconds. Although technically worse, that’s within the margin for error.
Whichever Raptor Lake CPU you go with, you’ll get fast, fluid turns in Civilization VI.
Power and thermals
Power draw and thermal output are two important considerations when building your PC as a whole, and the processor is one of two components that are the largest contributor to both. The GPU is likely to be the biggest draw on your system’s power, and the biggest outputter of excess heat, but this latest generation of Raptor Lake CPUs are particularly power hungry and are likely to output a lot of heat in turn.
To have a quick look at what kind of power these CPUs pull and to test the accuracy of the TDP ratings, I used HWInfo to check CPU package power during full load in a multi-threaded Cinebench run. I also took maximum temperature ratings for each CPU at idle, and during full load.
The CPUs were all cooled using the MSI MAG Coreliquid 360R V2 360mm. Although this cooler doesn’t natively support the LGA 1700 socket, I used the adapter kit to make it so. Throughout all tests, I used Thermal Grizzly Kryonaut heat paste applied fresh after each CPU swap.
Intel wasn’t lying with its high-power draw numbers as right out of the gate, the Core i5-13600K pulled as much as 145W during its Cinebench run. It settled at its rated maximum frequency of 5.1GHz across all six P cores, and 3.9GHz across all E cores. Its maximum temperature was an average of 69 degrees across all P cores and there was no thermal throttling at all. This suggests there could well be some impressive overclocking headroom on this CPU, which we’ll get to in the next section.
The Core i7-13700K has two more cores and ran at much higher clocks, and its temperatures and power draw jumped up in turn. With eight cores sitting comfortably at 5.3GHz throughout its benchmark run, and all E cores at 4.2GHz, it hit an average load temperature of 82 degrees and pulled 216W. That’s a lot of power, but notably less than the 253W max power draw its rated for, again suggesting there may be some solid overclocking headroom.
The Core i9-13900K, however, ran much hotter than all the others. It pulled just under 300W as soon as the benchmark began, and its temperature quickly climbed up to 100 degrees and then sat around there or the high-90s for the duration of the run. Unfortunately, this put it into thermal throttling territory, and I saw a maximum frequency of 5.5GHz on multiple cores, only to see that fall to 5.1GHz stable across all eight P cores. The E core boost frequency sat at 4.3GHz throughout the duration.
This is a surprise considering its at stock frequencies and fitted with high-end AIO watercooler. I tried remounting the cooler and even applying additional pressure just in case the LGA 1700 conversion kit had introduced some contact issue, but it didn’t make any difference. Clearly if you want the 13900K to reach its full potential, you will need a very powerful cooling solution, potentially moving into custom watercooling territory. Liquid metal thermal interface material may help, too.
Overclocking
One of the main reasons to choose Intel’s K-series 13th generation processors over the upcoming non-K counterparts, is because they allow for overclocking. While direct CPU overclocking hasn’t been as impressive in recent generations, there were a few results in these tests which suggest there might be some more headroom available – at least on the two lower end CPUs.
In-depth overclocking is a real science, however, and goes beyond the scope of this first review, so to keep things simple, I didn’t make any adjustments in the BIOS, but tweaked each CPU in the Intel XTU overclocking tool. I provided each of the CPUs with more power by raising the VCORE and then raised the multipliers for the P cores and E cores as far as they would go, within thermal limits.
As expected, the Core i5-13600K showed the most positive response to overclocking. By raising its voltage slightly, I was able to have it run all its P cores at 5.4GHz, and all E cores at 4.3GHz, a 300MHz, and 400MHz overclock, respectively. This resulted in a power draw of 167W when flat out, with temperatures touching 83 degrees at the top end.
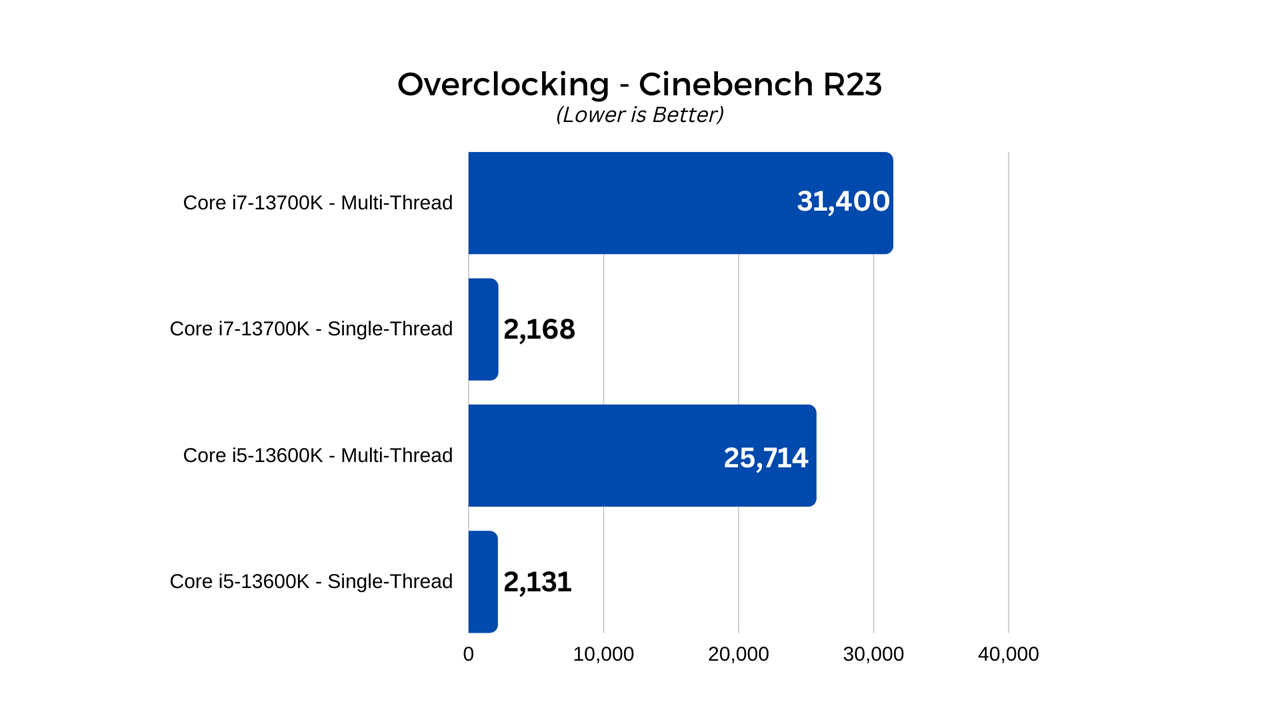
This resulted in multi-threaded and single threaded Cinebench scores of 25,714 and 2,131, respectively. That beats its initial 23,575, and 2,011, and even puts it beyond the single threaded score of the stock 13700K, at 2,104. Its Tomb Raider frame rates improved from 151,157, and 208, to 158, 161, 209.
The Core i7-13700K didn’t overclock quite as well, but I did manage to raise the P core frequencies a little. There, it managed to hold a sustained 5.5GHz all core overclock, lifting the Cinebench scores from 30,362, and 2,104, to 31,400, and 2,168. Tomb Raider frame rates were unaffected, however, and this overclock saw temperatures rise to 95 degrees when loaded, and power demand to spike an additional 9W, to 225W.
Unfortunately, with little thermal headroom to play with, I was unable to get the 13900K to effectively overclock. Although I could set more cores to 5.8GHz without it crashing, thermal throttling kicked in before any kind of higher frequencies were possible. More advanced cooling might open up some overclocking headroom, but it won’t be much.
All in all, the 13600K showed by far the best results from overclocking, but even then the real world performance difference isn’t much for a big uplift in thermal and power demands. If you have the headroom, then certainly it’s worth considering, but take into account the additional noise levels you’re likely to see with a more demanding CPU, and it may not be worth it.
Conclusion
Intel’s 13th generation Raptor Lake processors are performance powerhouses, able to churn through productivity tasks as well as some of the most demanding games with ease. Pair them with capable memory and a good graphics card, and there’s nothing they can’t handle.
But which CPU is right for you? From our tests, the best bang for buck is definitely to be found at the lower end, with the Core i5-13600K in particular offering amazing value for money. It’s close to the higher end options in gaming, within 10-20% at worst, and its eight E cores make it incredibly impressive at multi-threaded workloads and multitasking. Although it might be best for gamers who don’t need the additional cores of the top CPUs, it would be equally great as a streaming PC or when doing a little video and photo editing.
The CPU I would personally pick, however, is the Core i7-13700K. It has performance that gets very close to the 13900K, outside of the most heavily multi-threaded applications, and runs a bit more budget-friendly. It also doesn’t get anywhere near as hot, and if you want to overclock it, there is some room to play with. Personally, I’d leave it at stock and enjoy it as it is, but for those who want to tweak, the option is there.
The Core i9-13900K is the undisputed king of the hill. If you want maximum performance, it’s the best CPU for the job. However, that does come with a major caveat: it is extremely demanding. If you’re looking to run a CPU like this, you have to cool it effectively. That means a big custom watercooling loop, or at the very least one of the top air coolers or AIOs that are rated to handle 300 watts or more.
Ultimately, though, whichever Raptor Lake CPU you go for, you’re going to see a big upgrade in performance over even recent-generation flagships. They are stupendously powerful, even if they do run a little hot.